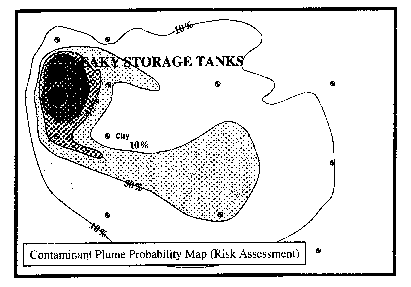
Figure 1.5: A risk assessment map of the contaminants reaching specified zones over a given time interval at a concentration level of 1ppm is based on the results of contaminant transport models through a number of alternative descriptions of the subsurface similar to those described in Figure 1.3 and 1.4. This map is a composite of model results; for example, a location defined as having a 50% probability of exceeding the 1ppm concentration level would have exceeded 1ppm in half the simulations modeled (not exceeded in the remaining half). This analysis provides the modeler with a measure of risk in evaluating where the contaminant will travel.